Want more from Front Office Sports
in your search results?
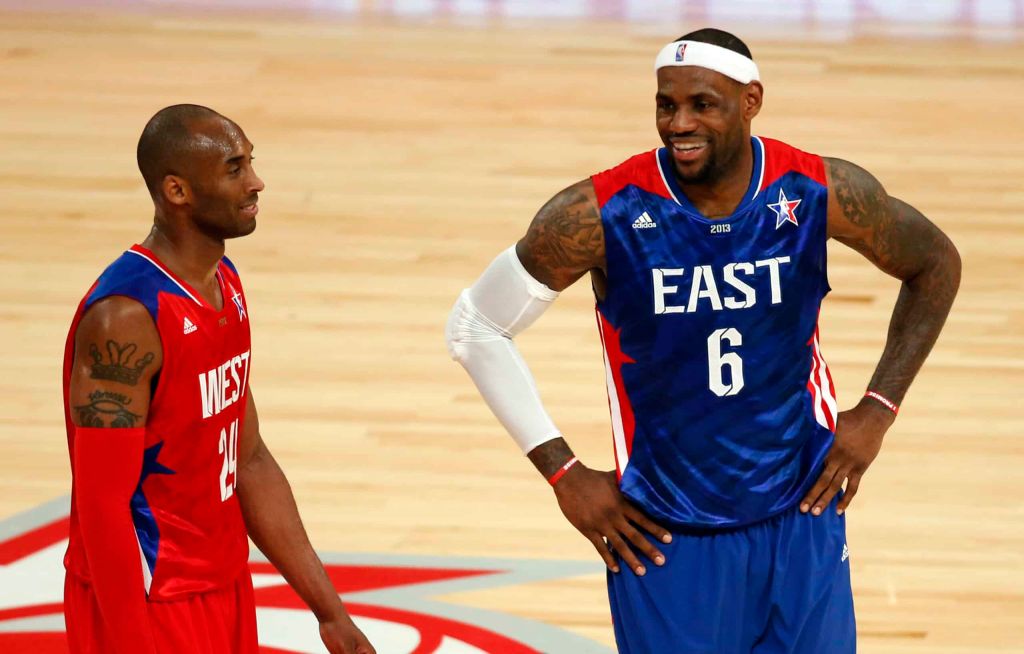
The NBA All-Star Game, which annually showcases the global game for three days in mid-February, is considered the crown jewel event for the Association.
Michael Jordan. Larry Bird. Magic Johnson. LeBron James. Kobe Bryant.
Over the years, these players and many others have shown off their talent during the weekend events, which conclude in an exhibition basketball game.
The game has evolved over the years, including format changes: After the 2017 New Orleans game, the league moved away from the traditional Eastern vs. Western Conference All-Stars. Beginning in 2018 in Los Angeles, the top two vote-getters were elected captains and drafted their teams. It’s also experimented with round robins and even went back to East vs. West one year. In 2027, it will play U.S. vs. Rest of the World.
If viewership is considered the barometer of success for the event, then the 1990s should be regarded as the Golden Age: Eight of the 10 most watched games were played in that decade.
The most viewed All-Star Game was in 1993 in Salt Lake City, which amassed 22.91 million viewers on NBC. That game featured the likes of Michael Jordan, Shaquille O’Neal, Charles Barkley, Scottie Pippen, Clyde Drexler, and hosts Karl Malone and John Stockton.
Over the years, ratings have dropped considerably. The last time an All-Star Game surpassed 10 million viewers was the 2003 game in Atlanta in TNT’s debut broadcast. The highest since then was the 2011 Game in Las Angeles, where TNT garnered just over 9 million viewers.
Can 2027’s All-Star Game in Phoenix recapture the magic from 30 years ago? The trends say no, although the 2026 L.A. All-Star Game was the most watched since 2011.
Top Most Viewed All-Star Games
| Year | City | Network | Viewership |
|---|---|---|---|
| 1993 | Salt Lake City | NBC | 22.914 million |
| 1992 | Orlando | NBC | 18.828 million |
| 1996 | San Antonio | NBC | 17.459 million |
| 1998 | New York | NBC | 16.931 million |
| 1997 | Cleveland | NBC | 16.903 million |
| 1995 | Phoenix | NBC | 15.775 million |
| 1994 | Minneapolis | NBC | 13.670 million |
| 1990 | Miami | CBS | 13.200 million |
| 2002 | Philadelphia | NBC | 13.103 million |
| 2003 | Atlanta | TNT | 10.829 million |
Download the FOS App
The business of sports, in your pocket.



Scan the QR code to get the app now.