Executive Summary:
It’s that time of year. The time when some of the world’s most prominent brands attempt to grab consumers’ attention. That’s right — it’s Super Bowl time.
The NFL’s playoff viewership numbers were up significantly across the board compared to the 2021 campaign, in line with the increased viewership during the regular season compared to the year prior. According to data posted by Deadline, the 2022 Championship Round matchups posted the highest viewership totals ever (AFC) and highest since 2014 (NFC). The breakdown was as follows:
- Divisional round games: Averaged 38.2 million viewers — the highest for the round on record — with the viewership marking a 21% increase from last season.
- NFC Championship: The Rams-49ers matchup in the NFC Championship game hit 50.4 million viewers across Fox, Fox Deportes, Fox Sports streaming platforms, NFL Digital and Yahoo! Sports properties.
- AFC Championship: The Bengals-Chiefs matchup in the AFC Championship game averaged 47.6 million viewers, according to CBS, making it the most-watched title game in the early time slot in six years
- All three playoff rounds: Up by double-digit percentages year to year, which followed regular-season gains of 7% versus 2021.
The Super Bowl is anticipated to follow the same trend. Last year’s matchup between the Buccaneers and Chiefs drew the lowest total (96.4 million viewers) since 2007.
Why does this matter? Due to the magnitude of the total viewership, the Super Bowl is a breeding ground for some of the top brands of the moment to flex their creative capital and bolster brand awareness and increase social profiles and sales revenues.
Last year’s “COVID impacted” matchup opened the doors for brands new to the scene, as legacy players pulled out over viewership concerns related to the pandemic. While this year’s Super Bowl ad inventory sold out by September of 2021, brands opted for new and creative ways to get their products and services in front of potential customers. Legacy brands are shying away, and incumbent industry players such as crypto and FinTech companies will be taking center stage. The question is: Will these brands be able to generate sufficient revenues and social capital to justify the $6.5 million spent on a 30-second advertisement?
The historical data on the subject would indicate that if a company is able to successfully leverage the most-watched event of the year, meaningful sales increases are possible. Data on the subject, however, is not definitive. Calculating true return on ad spend (“ROAS”) can be a difficult endeavor.
Historical Data:
TV Viewership
First and foremost, it is important to note that of the 30 most-viewed live television events of all time, only two have not been Super Bowls (the “M*A*S*H” series finale and Spinks vs. Ali).
While historically viewership has been high, there has been a relative decline in the growth of viewership. Additionally, while the gross number of viewers is high, when looking over a 20-year time horizon, the annual growth in viewership has been below 1.0% year-over-year. While that number might be surprising given the low growth, it is actually in line with the trends in U.S. population growth.
The correlation is moderate (0.3 correlation coefficient), but the higher variance in viewership growth skews the data upward when the overall trend is a decrease in total viewership.
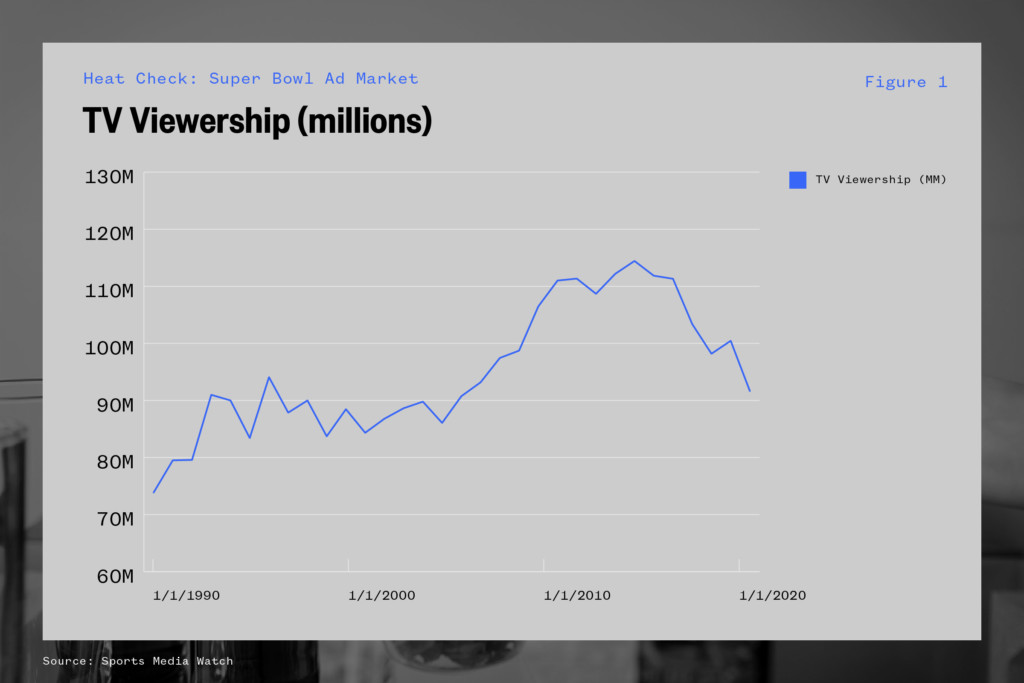
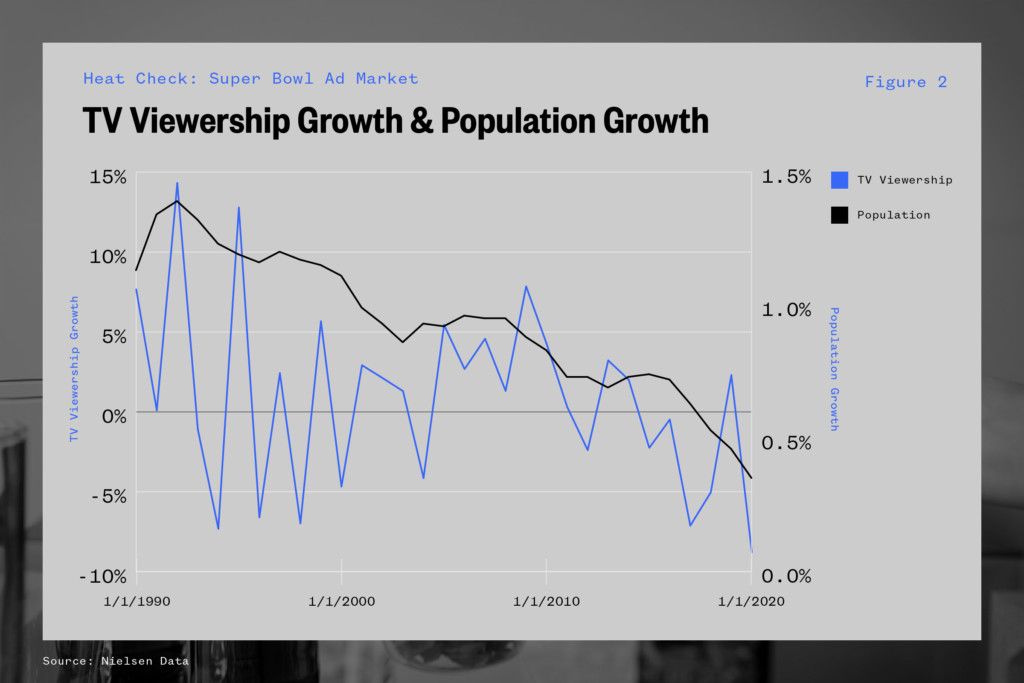
This year’s Super Bowl is anticipated to reach 100 million viewers once again — a promising sign. The overall market for linear TV viewership, however, has clearly shown signs of weakening, and new mechanisms for capturing consumer attention (i.e. social media) are beginning to supplant some of these larger audience opportunities.
Ad Spend
While viewership trends have seen declines in growth, costs of advertisements have increased 117% since 2004, with an average annual increase of 4.6%. According to the data, the advertising “real estate” is growing at a rate that appears to be faster than the overall growth in viewership.
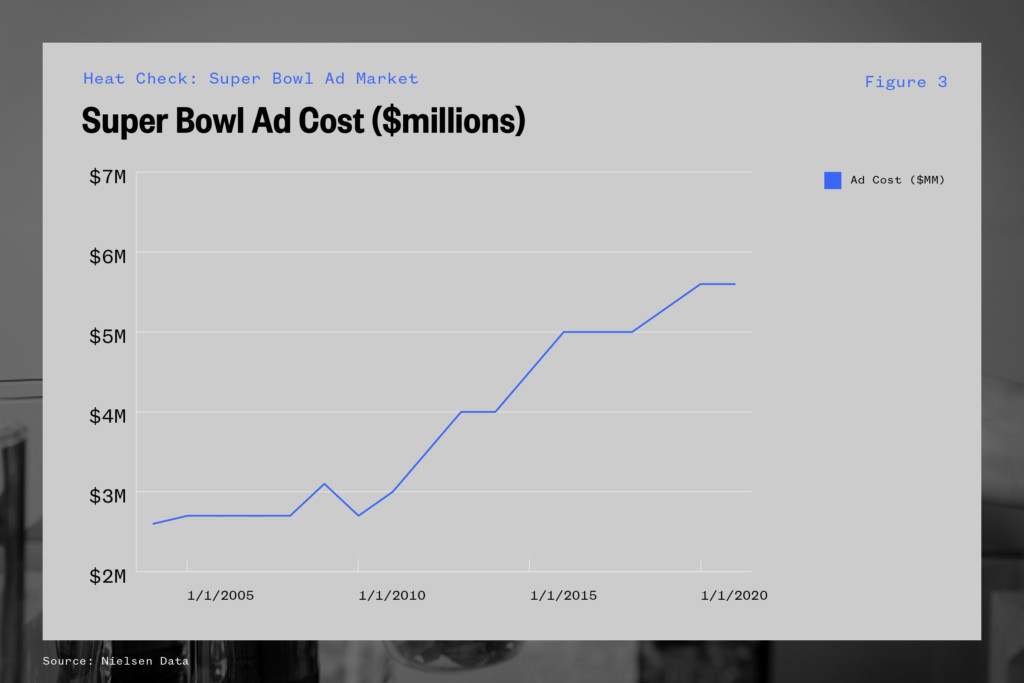
The cost can be related to social cache and brand awareness, which are more difficult to concretely measure, but from an ad-spend perspective, costs are outpacing viewership.
Resulting Consumer Spending
The next question is whether or not these ads result in consumer spending. In 2019, researchers from the University of Humboldt and Stanford University published a study on three established brands regarding their sales in the weeks following the Super Bowl. The results of the study of three key brands (Anheuser-Busch, Coca-Cola, and Pepsi) found that the Super Bowl ads increased revenue by 10%-15% per household in the following eight weeks.
One key additional finding was that the 10%-15% increase in revenue would actually turn to losses if a direct competitor advertised during the game.
The ability to convert ads into sales specifically from Super Bowl ads is difficult to quantify. There is evidence, however, that in a vacuum there can be meaningful increases in sales. Historically, brands that built a social media campaign to follow their Super Bowl advertisements were successful in keeping their products on consumers’ minds through subsequent months. Companies that were the sole advertiser within a specific product category received the greatest long-term value.
Digital Live Sports Viewers as a % of Population
There is some promising data related to digital live sports viewership. According to data from eMarketer, the number of digital live sports viewers are expected to grow from 57.5 million in 2021 to 90.7 million in 2025. This represents a 12% annual growth rate and has the potential to increase the total number of households that large scale sporting events can reach.
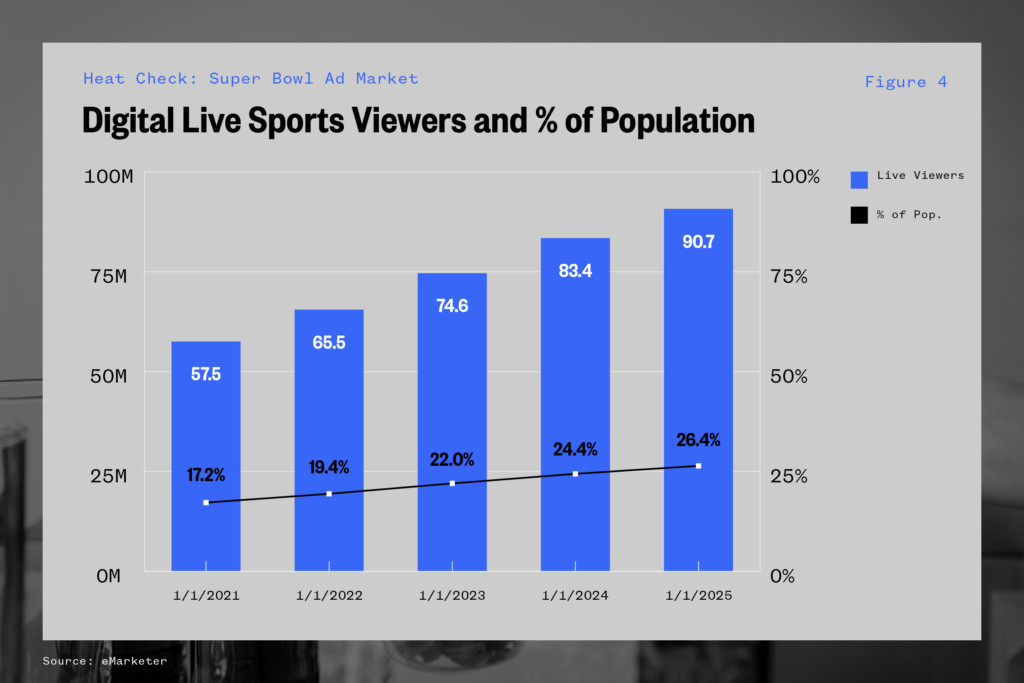
The growth in digital viewership is also anticipated to outpace population growth and capture a larger total share of the U.S. population. While this has the potential to impact the Super Bowl specifically, there are broader implications for the total reach of digital sports viewership. As streaming players continue to increase their live sports rights and properties, we could potentially see the 90.7 million figure sooner than 2025.
This Year’s Lineup:
Looking at this year’s lineup, there is a clear trend. New incumbents, particularly crypto, FinTech, and MedTech, will be taking the big stage, along with some players such as Lays making returns for the first time in almost two decades.
| Company | Industry |
| Amazon Prime Video | Web Services |
| Anheuser Busch | Beverage |
| Avocados from Mexico | Food |
| BMW | Auto |
| Carvana | Auto |
| Booking.com | Web Services |
| Doritos/Cheetos | Food |
| DrafKings | Web Services |
| E-Trade | Financials |
| Expedia | Web Services |
| FTX | Crypto |
| Crypto.com | Crypto |
| General Motors | Auto |
| Web Services | |
| Hologic | Miscellaneous |
| Kia | Automotive |
| Lay’s | Food |
| Meta | Web Services |
| Nissan | Auto |
| Pringles | Food |
| QuickBooks | Financials |
| Rakuten | Web Services |
| Sam’s Club | Food |
| Squarespace | Web Services |
| Taco Bell | Food |
| Irish Spring | CPG |
| Toyota | Automotive |
| TurboTax | Financial |
| Turkish Airlines | Miscellaneous |
| Uber Eats | Web Services |
| Ceasar’s Sportsbook | Web Services |
| Verizon | Telecom |
| Vroom | Web Services |
| Wallbox | Automotive |
| WeatherTech | Miscellaneous |
| Planet Fitness | Miscellaneous |
A key observation that can be drawn from the data is that certain trends from the investment landscape are making their way onto the big stage. We have already mentioned the presence of crypto companies such as FTX and Crypto.com. There are also ads for electric vehicles (Nissan and GM), Meta will be running its first large ad spot since the rebrand from Facebook, and sports betting company DraftKings is back for its second ad spot after a successful campaign in 2021.
Case Studies & Additional Data:
In 2021, Mountain Dew launched its newest flavor, Major Melon, in a 30-second ad that featured John Cena and a plethora of Major Melon Mountain Dew bottles. The innovation in the ad did not come from the creative direction, but rather the incentives that Mountain Dew created.
Mountain Dew’s sole goal with the spot was to “own Twitter.” Accordingly, they announced that the individual who was able to accurately count and tweet the correct number of Mountain Dew bottles would receive $1 million. According to their advertising agency, Mountain Dew saw 560 guesses and mentions per second after the airing of the ad. According to a report, the brand hit its yearly sales goals within 12 weeks of launching the campaign.
Another resource related to NFL marketing trends on social media is Twitter’s metrics on NFL playoff marketing. From a social media standpoint, it is also interesting to note that State Farm opted out of TV advertising entirely and instead has opted to utilize social platform TikTok to reach potential customers.
In their Super Bowl campaign, users will be asked to show off their talents with the social platform’s duet feature and use the #TeamStateFarm. On Super Bowl Sunday, the top three videos will be pinned to the top of Jake’s (from State Farm’s) TikTok page. Users will then pick the winning video by liking their favorite.
In a statement, State Farm said its agency partners focused on TikTok to meet the next generation of consumers by showing up in the spaces where they’re spending their time. According to the reporting agency TransUnion, there has been increased spending by Gen Z and millennial on auto and other forms of insurance year-over-year, while baby boomer and Gen X spending on those categories are down. TikTok represents the “meeting ground” for State Farm’s desired customers.

