As MLS begins the second half of its 2019 season following last week’s all-star game, attendance across the league is down roughly four percent.
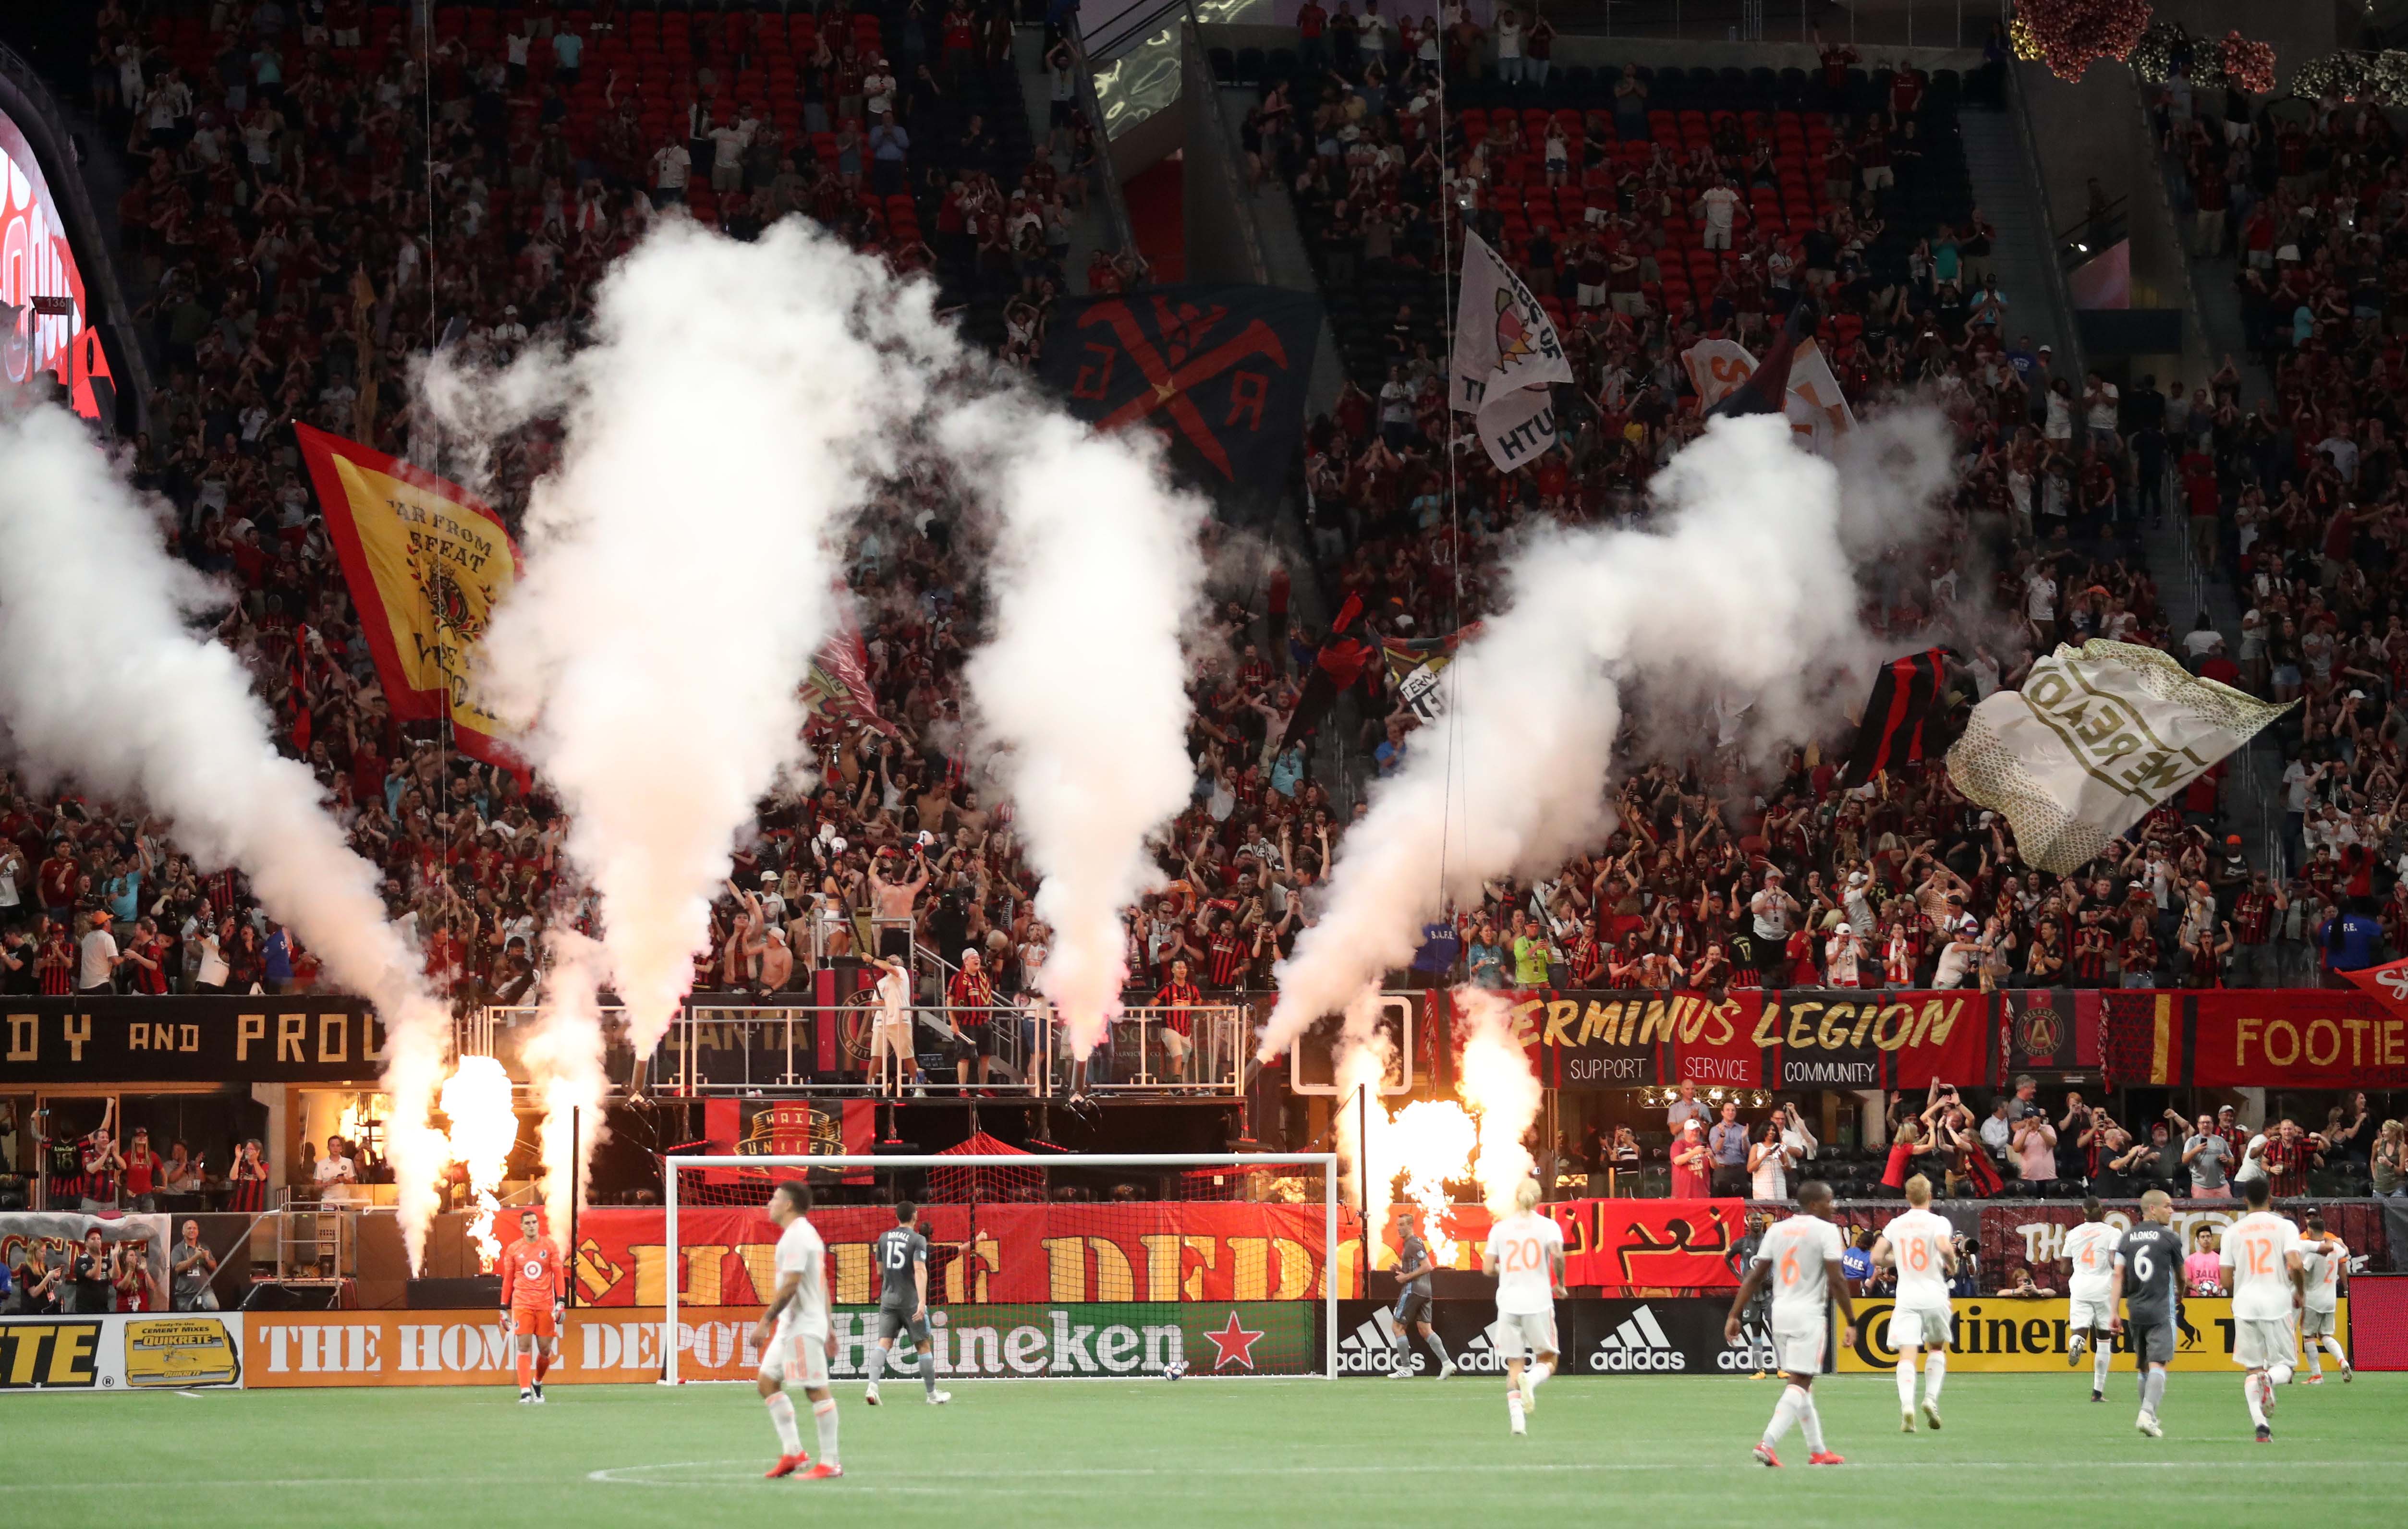
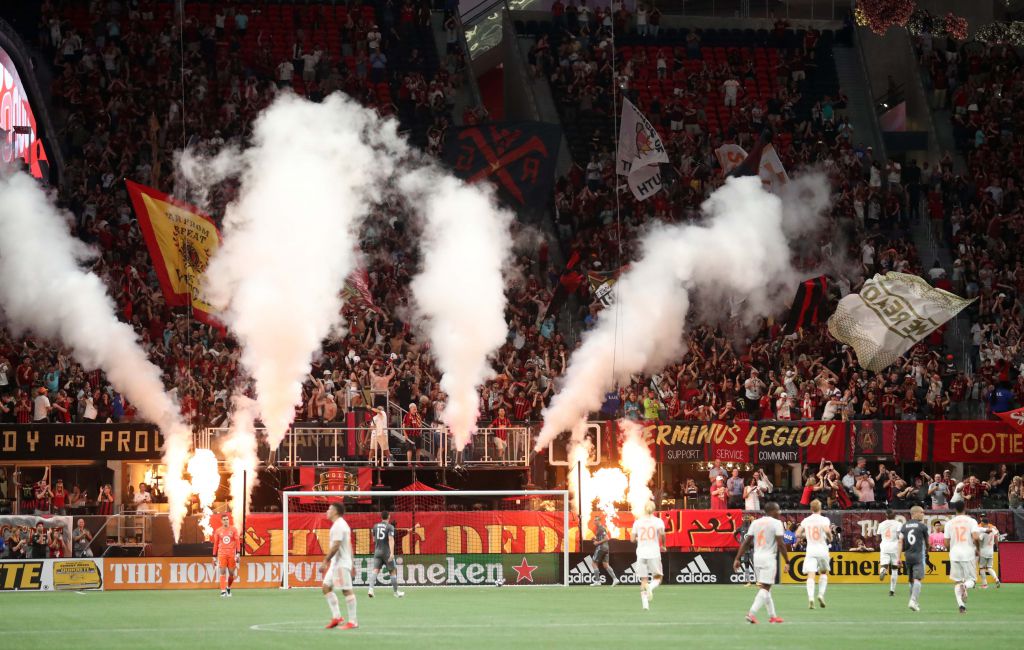
Atlanta United, fresh off setting a league regular season record Saturday with a crowd of 72,548, once again leads the league averaging 53,269 fans per game. That paces ahead of last year’s league-record average of 53,002.
FC Cincinnati is also drawing well in its first season in MLS, averaging 27,691 fans across its 11 home matches thus far, good for third-best in the league.
However, as MLS has had to shift more of its matches mid-week due to the league’s newly condensed scheduled, attendance has slid thus far in most markets. Across the league’s 23 clubs, 18 have seen year-over-year attendance declines. Minnesota United has seen its attendance technically decline year-over-year due to its move to the smaller Allianz Field, where it has sold out every game.
READ MORE: MLS Goes Digital For New All-Star Skills Challenge
The Chicago Fire are currently drawing the smallest crowds in the league, and have seen the biggest dropoff year-over-year amid its struggles on the field. However, with a move to Soldier Field expected in 2020, those figures should rebound massively next season.
On the positive side, the Columbus Crew are seeing the largest increase so far this season with a more than 21% year-over-year attendance increase. While the club’s 13,647 average attendance is the second-lowest in MLS, that large uptick is a positive harbinger for the club in its first season under new ownership with plans to open a new stadium in 2021.
MLS Commissioner Don Garber downplayed the numbers thus far, noting several factors.
“We try to not look at where we are today versus where we’ll be at the end of the year – there are so many things that go into that. We still have [full-stadium] Atlanta United games, Portland was on the road for 12 games, rivalry week hasn’t started yet,” he said. “So we’ll see where it goes by the end of the year.”
MLS Attendance Through August 4
Club Games Played / Average. % Capacity / Previous Average YoY Change / Games Played (’18)
Atlanta United: 13 / 692,497 / 53,269 / 104.5% / 50,063 / 6.4% / 13
Seattle Sounders: 12 / 475,952 / 39,663 / 100.6% / 40,494 / -2.1% / 10
FC Cincinnati: 11 / 304,605 / 27,691 / 81.9% / n/a n/a n/a
Portland Timbers: 6 / 151,308 / 25,218 / 100.0% / 21,144 / 19.3% / 10
Toronto FC: 13 / 323,838 / 24,911 / 82.4% / 26,713 / -6.7% / 10
LA Galaxy: 12 / 274,761 / 22,897 / 89.2% / 24,501 / -6.5% / 11
Orlando City: 12 / 274,356 / 22,863 / 89.6% / 24,085 / -5.1% / 12
LAFC: 10 / 222,251 / 22,225 / 89.2% / 22,065 / 0.7% / 10
NYCFC: 10 / 206,512 / 20,651 / 71.8% / 23,034 / -10.3% / 12
Vancouver Whitecaps: 12 / 239,760 / 19,980 / 90.3% / 21,490 / -7.0% / 11
Minnesota United: 12 / 236,974 / 19,748 / 100.8% / 22,317 / -11.5% / 13
San Jose Earthquakes: 13 / 249,839 / 19,218 / 106.8% / 20,384 / -5.7% / 10
Sporting K.C.: 11 / 207,908 / 18,901 / 102.3% / 19,986 / -5.4% / 11
Real Salt Lake: 11 / 195,477 / 17,771 / 87.9% / 18,121 / -1.9% / 12
DC United: 13 / 226,115 / 17,393 / 87.0% / 14,939 / 16.4% / 5
New York Red Bulls: 13 / 219,123 / 16,856 / 66.8% / 18,335 / -8.1% / 12
Philadelphia Union: 12 / 197,372 / 16,448 / 90.8% / 16,275 / 1.1% / 11
Montreal Impact: 11 / 176,859 / 16,078 / 75.6% / 18,285 / -12.1% / 12
Houston Dynamo: 13 / 200,517 / 15,424 / 70.0% / 16,873 / -8.6% / 12
New England Revolution: 13 / 198,839 / 15,295 / 76.5% / 17,143 / -10.8% / 12
FC Dallas: 12 / 175,596 / 14,633 / 91.5% / 15,017 / -2.6% / 12
Colorado Rapids: 13 / 185,059 / 14,235 / 81.7% / 15,333 / -7.2% / 13
Columbus Crew: 13 / 177,405 / 13,647 / 65.3% / 11,207 / 21.8% / 12
Chicago Fire: 13 / 153,009 / 11,770 / 68.9% / 14,107 / -16.6% / 13
Totals
284 / 5,965,932 / 21,007 / 87.3% / 21,873 / -4.0% / 391
