A softer part of the college football season has resulted in a smaller increase in viewership compared to last year.
Nielsen said this week that college football viewership across all networks through 11 weeks is up 2% compared to last year, when comparing data from the new Big Data + Panel measurement process to similar figures from 2024.
That college football comparison from this year to last using the Big Data + Panel methodology is the result of additional research from Nielsen, as standard year-over-year comparisons for other programming involve prior, panel-based data from 2024.
The 2% lift for college football, however, is down sharply from a 10.5% gain seen in early October. A key reason for the more recent retreat is a heavily front-loaded schedule this year, including a massive Week 1 matchup between defending national champion Ohio State and then–No. 1 Texas. That clash averaged 16.6 million viewers, and is still the most-watched game of this season.
A key viewership test will arrive later this month and in early December, as the latter stretch of the season will include the revival of the famed Ohio State–Michigan rivalry and major conference championship games.
Another notable factor is a marked variance between the most popular college teams among viewers, and those at the top of the Associated Press Top 25 rankings. According to Nielsen, the five most-watched teams this season for average viewership are:
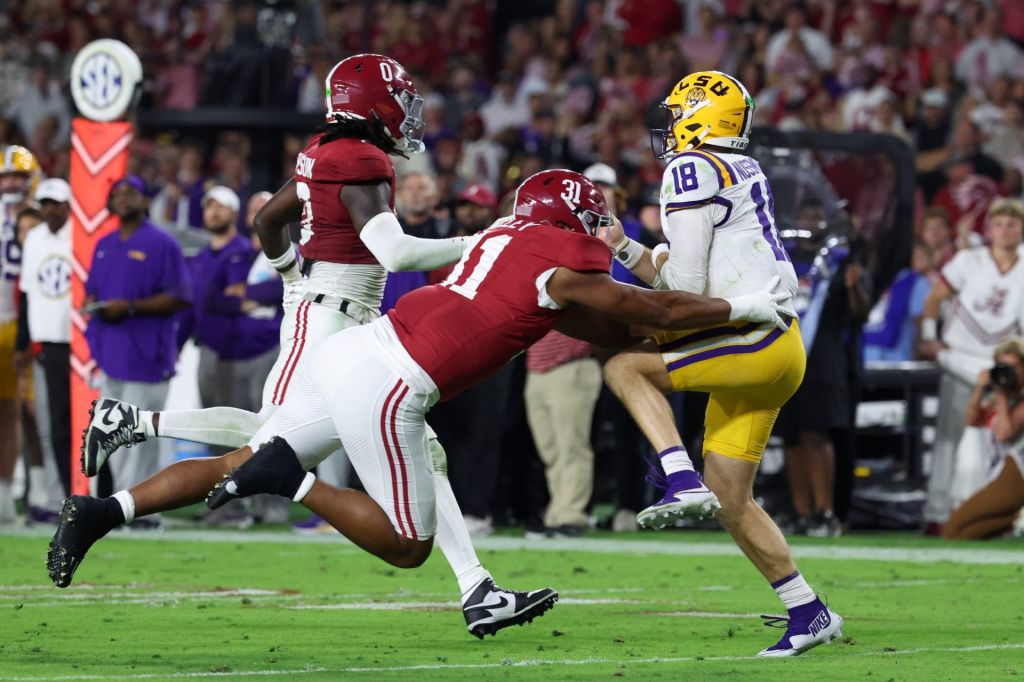
- Alabama: 7.865 million
- Tennessee: 7.032 million
- Georgia: 6.996 million
- Texas: 6.479 million
- LSU: 6.420 million
Alabama, however, is ranked No. 4 in the AP poll, while Tennessee is No. 23, Georgia is No. 5, Texas is No. 10, and unranked LSU is mired in controversy.
Top-ranked Ohio State is seventh with an average of 5.752 million viewers per game, while No. 2 Indiana does not show up in Nielsen’s top 15.