At its height, the MLB Home Run Derby was watched by nearly 10 million viewers. Recently, viewership has not been as strong as expected, but the MLB hopes new technological innovations and format changes will rekindle strong numbers in 2025 and beyond.
The most-watched MLB Home Run derbies share similar characteristics: enticing matchups that go down to the wire and plenty of home runs.
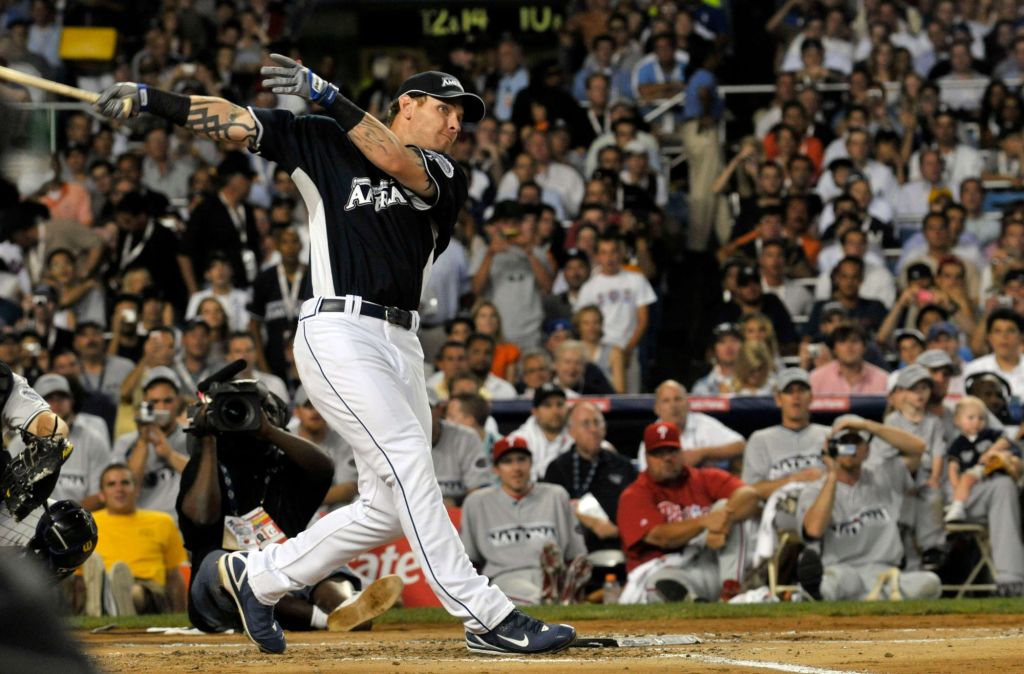
The 2008 MLB Home Run Derby was the most-watched derby ever, with 9.1 million viewers. Fans tuned in to watch Josh Hamilton of the Rangers slug 28 home runs in the first round, setting a record.
Justin Morneau eventually won, beating Hamilton in a close final round 5 to 3.
Second is the 2017 MLB Home Run Derby, which drew 8.6 million viewers. The viewership rating reflected a 55% increase from the previous year. The winner, Aaron Judge, hit four home runs over 500 feet during the event.
The 2017 edition was the third year with new rule changes to the format, designed to speed things up to keep audiences interested.
The only other derby with at least 8 million viewers is the 2009 MLB Home Run Derby, which ranks third.
The 2009 derby was a disappointing showing compared to 2008, with 8.25 million viewers, a 9.5% year-over-year decline. It ran much longer than the scheduled two hours and had one of the lowest total home run hits among the most-watched derbies.
Prince Fielder eventually won, beating Nelson Cruz in the last round 6 to 5, but only 82 home runs were hit on the night.
More home runs don’t necessarily guarantee higher viewership. Three of the top five most-watched MLB Home Run derbies had less than 100 home runs hit in total.
The 2021 MLB Home Run Derby had the most home runs hit of any derby listed with 309. Even though that year’s version marked a renaissance in viewership amid a downward trend, it’s only tied for sixth with 7.1 million viewers.
Ranking The Most-Watched MLB Home Run Derbies Ever
Here is the list of the top 10 most-watched MLB Home Run Derbies based on total viewership. The list was compiled using historical data from Sports Business Journal and ESPN Press Room.
- Updated: March 27, 2025
| Ranking | Year | Winner | Total Home Runs (All Contestants) | Total Viewers |
| 1 | 2008 | Justin Morneau | 105 | 9.1 million |
| 2 | 2017 | Aaron Judge | 195 | 8.6 million |
| 3 | 2009 | Prince Fielder | 82 | 8.25 million |
| T-4 | 2004 | Miguel Tejada | 88 | 7.7 million |
| T-4 | 2002 | Jason Giambi | 72 | 7.7 million |
| T-6 | 2021 | Pete Alonso | 309 | 7.1 million |
| T-6 | 2015 | Todd Frazier | 159 | 7.1 million |
| 8 | 2012 | Prince Fielder | 82 | 6.9 million |
| 9 | 2022 | Juan Soto | 291 | 6.88 million |
| T-10 | 2007 | Vladimir Guerrero Sr. | 74 | 6.8 million |
| T-10 | 2006 | Ryan Howard | 87 | 6.8 million |
Related lists: