By: Samotria Holmes
Since collegiate sports clubs began in the United States in 1843 [1], fans have been as much a part of the team as the players and coaches. They represent family, friends, and encouraging onlookers that all pine for the very best spot to see their favorite player or team: the spot where they can see all of the moves, plays, fouls, and even facial expressions. For many fans — and for a very long time — the best spot was right in the middle as close to the field of play as possible. And, with most sports involving some kind of volley between sides, it makes sense that the best seat would be smack in the middle…right? Well, not exactly. That statement makes some pretty big assumptions about what fans think, want and value; things like:
● The best seats are on the 50-yard-line or center court
● The closer you are to the field of play, the better your in-game experience
● It does not matter who you are sitting with, as long as you have great seats
● Fans want to be as close to the field of play as possible
● Being close to the team playing is more important that sitting with the group I travelled to the game with
These assumptions would ring true if every person that attended a sporting event was a die-hard fan; however, that is not the makeup of today’s stadium. In addition to more casual fans attending games, there are an increased number of categories of fans attending games today including families that bring young children, persons with physical challenges, and women. These new categories of consumers have helped to build a multi-billion dollar primary collegiate ticket industry and an equally impressive $4 billion secondary ticket market [2]. The size of the secondary ticket market shows us that there is a substantial disconnect between the school, which thinks their season ticket holders fill its stadium versus the fans, who bought their ticket through the secondary market and showed up in the season ticket holders’ place.
What does this mean for fans and athletic programs?
● Each fan, regardless of category or demographic, defines the perfect game experience.
● Athletic departments’ metrics on fan demographics are skewed.
What are fans willing to spend money on?
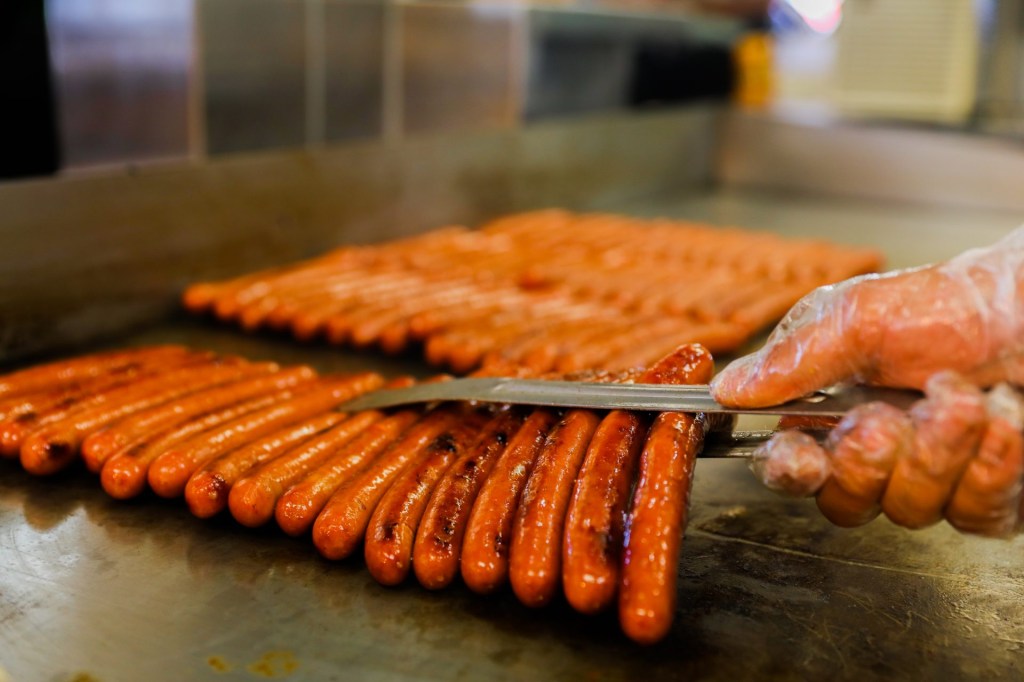
Food, merchandise, and convenience. Fans are not afraid to spend money on nachos, hot dogs, soda, programs, or the best parking spot. When we look at the revenue generated from concessions in FBS schools, that median has ticked up from $660,000 in 2008 to over $1M in 2013 according to the NCAA and have consistently represented 3% of total revenue for FBS schools in the same time frame [3],[4].
The NCAA has regularly noted in their financial reports since 2008, the growing gap between FBS college athletic programs that are profitable versus the programs that operate at a loss [4],[5]. They also call out the three areas in which schools generate the most revenue; ticket sales, donor contribution, and conference distributions. They state that, “Although revenues continue to increase in all three subdivisions, expenses continue to increase at a faster pace [4].”
As expenses rise, and in many cases outpace revenue, college athletic programs have attempted to get more fans in seats that are willing to making donations and buy merchandise. Some have invested millions in fan targeted technology enhancements that will help to encourage ticket sales and in-game spend like custom phone apps. In 2012 the University of Michigan earned nearly $2M in concessions, parking, and program sales alone [5]. Think of how simple it would be for Michigan to double that number by enticing ⅓ of their stadium’s capacity to spend an extra $10 per home game, assuming 6 home games. Opportunities for new revenue streams are needed to support the demands of managing an athletic department.
What if athletic departments knew…?
● How many nursing moms attended games?
● Which social groups responded most positively to digital signage?
● How many fans would pay for pictures with the team mascot?
● The number of fans that identify as vegan or vegetarian
● The actual number of fans in the stadium?
At this year’s International Conference on Gambling and Risk Taking, Steve Wynn, CEO of Wynn Resorts Limited, discussed a strategy shift that was less aligned to traditional insights on revenue generation in a casino and more focused on guest behavior [6]. When the Encore was added to the Wynn portfolio, the first year of casino revenue was $840 million while non-casino revenue was $1.1 billion [7]. Steve and his team heard this message loud and clear and are now creating revenue opportunities around non-gaming activities. College athletic programs do not have the amount of transaction clarity that a hotel property does, and as a result, can miss the mark on giving fans what they are looking for in a great game day experience. With more insight as to who is in the stands, athletic departments can more accurately market offerings that they can monetize to this further defined segment of fan.
Athletic departments can create custom season ticket offerings in smaller 3–5 game bundles and have better ideas on what kinds of merchandise to increase for those games. For example, if athletic programs knew what percent of the alumni-fans attending military appreciation day were age 60+ they could increase nostalgic merchandise and commemorative class reunion products. This kind of targeted data that is available with the BANDWAGON platform is what can ensure positive cash flows for athletic programs over time and enthused, supportive fans in the stands.
Factors that impact the fan experience
● Digital Signage
● Wi-Fi Bandwidth
● Seat Design
● Interactive Fan Games
● Concessions
● Facilities
● Weather Protection (shade, awnings)
● Restroom Proximity/Cleanliness
● Children’s Activities
● Merchandise
These are some ways fans are measuring their game day experience. More than ever, attending college sports events is like travel: more about the journey than the destination. The idea that the perfect game experience involves your physical person being right in the middle of the action has faded. Now, more than ever, customers are looking for curated experiences, activities, merchandise, and even food. The success of Birch Box, Blue Apron, Nutrisystem, Jetsetter, and many of the other hundreds of companies like them, is built on the idea that not only does one size NOT fit all, neither do the standard categories of small, medium, and large.
Today consumers can seriously say, “I’d like an extra medium” with confidence and in most respects receive a serious response. The BANDWAGON team and platform bring a unique expertise in our understanding of which fans are in the stadium, what technology investments fans will expect, and where schools should invest their fan engagement dollars. Our team is able to define what a perfect game day feels like by demographic and that empowers schools to monetize offerings to which fans attach value.
Samotria is a 2007 graduate of Clemson University where she studied Marketing before beginning a career in sales management. A self-described “cupcaker”, she loves to cook for family, friends, and occasionally caters events. As the President of Greenville-based BANDWAGON, she manages internal operations, strategic relationships, as well as the Campus Ambassador program.
You can follow along and learn more about Bandwagon one any one of their social channels.
ww.facebookcom/thebandwagonfanclub
www.instagram.com/bandwagonfanclub
[1] https://en.wikipedia.org/wiki/College_athletics_in_the_United_States#cite_note-Athletics-4
[2] https://www.nytimes.com/2013/06/09/magazine/the-secret-science-of-scalping-tickets.html?_r=0
[3] https://box5148.temp.domains/~frontof5/wp-content/uploads/2016/09/RE2008.pdf
[4] https://box5148.temp.domains/~frontof5/wp-content/uploads/2016/09/D1REVEXP2013.pdf
[5] https://smartycents.com/articles/college-football-revenue/
