Many factors influence audience numbers for the Stanley Cup Finals, but there’s one element that will always move the needle: the presence of the NHL’s Original Six teams.
The five most-watched Stanley Cup Finals featured at least one of those franchises: the Boston Bruins, Chicago Blackhawks, Detroit Red Wings, Montreal Canadiens, New York Rangers, and Toronto Maple Leafs. And the most-watched ever had two Original Six franchises facing off for the Cup.
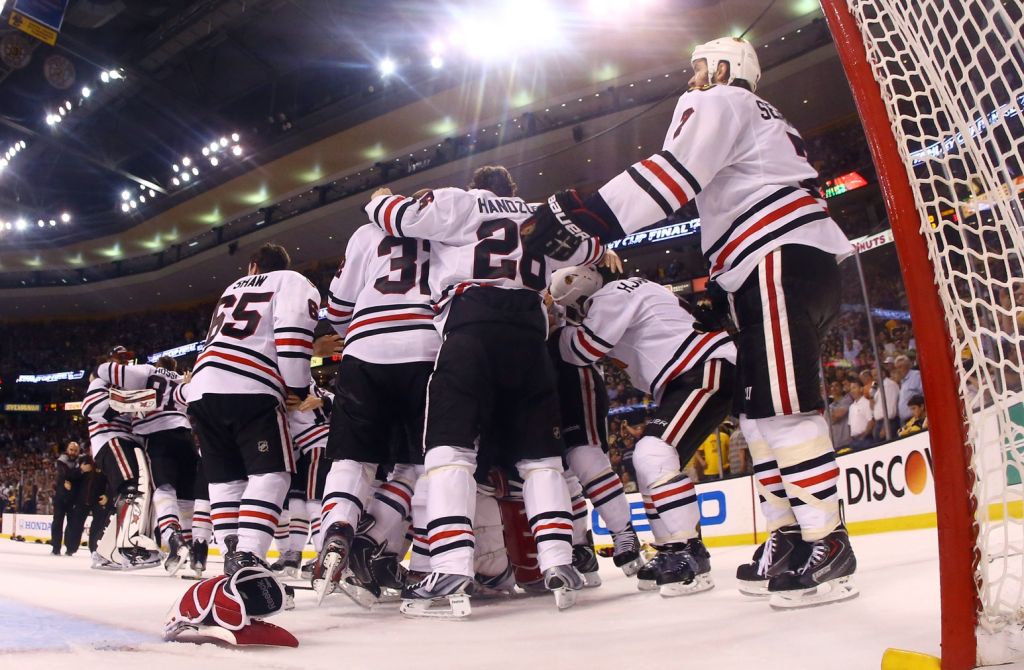
That series, the 2013 matchup between the Blackhawks and Bruins, attracted an average 5.76 million U.S. viewers across six games, and occurred during an NHL lockout year that condensed the regular season from its standard 82 games to 48.
The 2015, 2019, and 2010 Stanley Cup Finals rank nearly as high, with each series going at least six games and garnering more than 5 million viewers stateside. The Blackhawks or Bruins played in each.
The only finals in the top five not to feature Chicago or Boston was in 2002, when the Red Wings defeated the Hurricanes. Despite only going five games, the series still averaged an impressive 5.05 million viewers. The Red Wings steamrolled their way to the Stanley Cup that year with a stacked roster of future Hall of Famers, including Chris Chelios, Brett Hull, and Luc Robitaille.
The most-watched Stanley Cup Finals without any of the Original Six teams is 2018’s matchup between the Washington Capitals and the Vegas Golden Knights. The series pulled in an average of 4.79 million U.S. viewers, ranking seventh.
Ranking the Most Watched NHL Stanley Cup Finals
Here is the list of the most-watched NHL Stanley Cup finals based on average U.S. viewership. The list was compiled using historical data from SportsMediaWatch going back to 2002, unless otherwise stated. (Due to a lockout, there was no 2004–2005 season.)
| Year | Network | Avg. Viewership (million) | Winning Team | Losing Team | Series Result |
| 2013 | NBC/NBCSN | 5.76 | Blackhawks | Bruins | 4–2 |
| 2015 | NBC/NBCSN | 5.53 | Blackhawks | Lightning | 4–2 |
| 2019 | NBC/NBCSN | 5.34 | Blues | Bruins | 4–3 |
| 2010 | NBC/VERSUS | 5.20 | Blackhawks | Flyers | 4–2 |
| 2002 | ABC/ESPN | 5.05 | Red Wings | Hurricanes | 4–1 |
| 2009 | NBC/VERSUS | 4.91 | Penguins | Red Wings | 4–3 |
| 2018 | NBC/NBCSN | 4.79 | Capitals | Golden Knights | 4–1 |
| 2014 | NBC/NBCSN | 4.70 | Kings | Rangers | 4–1 |
| 2017 | NBC/NBCSN | 4.67 | Penguins | Predators | 4–2 |
| 2022 | ABC/ESPN+ | 4.60 | Avalanche | Lightning | 4–2 |
| 2011 | NBC/VERSUS | 4.56 | Bruins | Canucks | 4–3 |
| 2008 | NBC/VERSUS | 4.35 | Red Wings | Penguins | 4–2 |
| 2024 | ABC/ESPN+ | 4.20 | Panthers | Oilers | 4–3 |
| 2016 | NBC/NBCSN | 4.0 | Penguins | Sharks | 4–2 |
| 2003 | ABC/ESPN | 3.57 | Devils | Mighty Ducks | 4–3 |
| 2004 | ABC/ESPN | 3.17 | Lightning | Flames | 4–3 |
| 2012 | NBC/NBCSN | 3.15 | Kings | Devils | 4–2 |
| 2006 | NBC/OLN | 2.78 | Hurricanes | Oilers | 4–3 |
| 2023 | TNT/truTV/TBS | 2.63 | Golden Knights | Panthers | 4–1 |
| 2025 | TNT/truTV/MAX | 2.50 | Panthers | Oilers | 4–2 |
| 2021 | NBC/NBCSN | 2.41 | Lightning | Canadiens | 4–1 |
| 2020 | NBC/NBCSN | 2.03 | Lightning | Stars | 4–2 |
| 2007 | NBC/VERSUS | 1.74 | Ducks | Senators | 4–1 |
Related lists: