Valuing social media and TV exposure for your brand partners can be difficult, but given today’s increasingly digital landscape, it’s imperative to have the right metrics when selling or looking to re-up assets.
Thanks to technology, specifically AI and computer vision, the ability for teams, brands, and agencies to be able to better understand the impacts of exposure through social media, as well as TV, is becoming more streamlined.
One of the company’s leading this charge is GumGum Sports, the sports arm of GumGum, an artificial intelligence company with a focus on computer vision that cut its teeth in the advertising world before launching GumGum Sports in 2016.
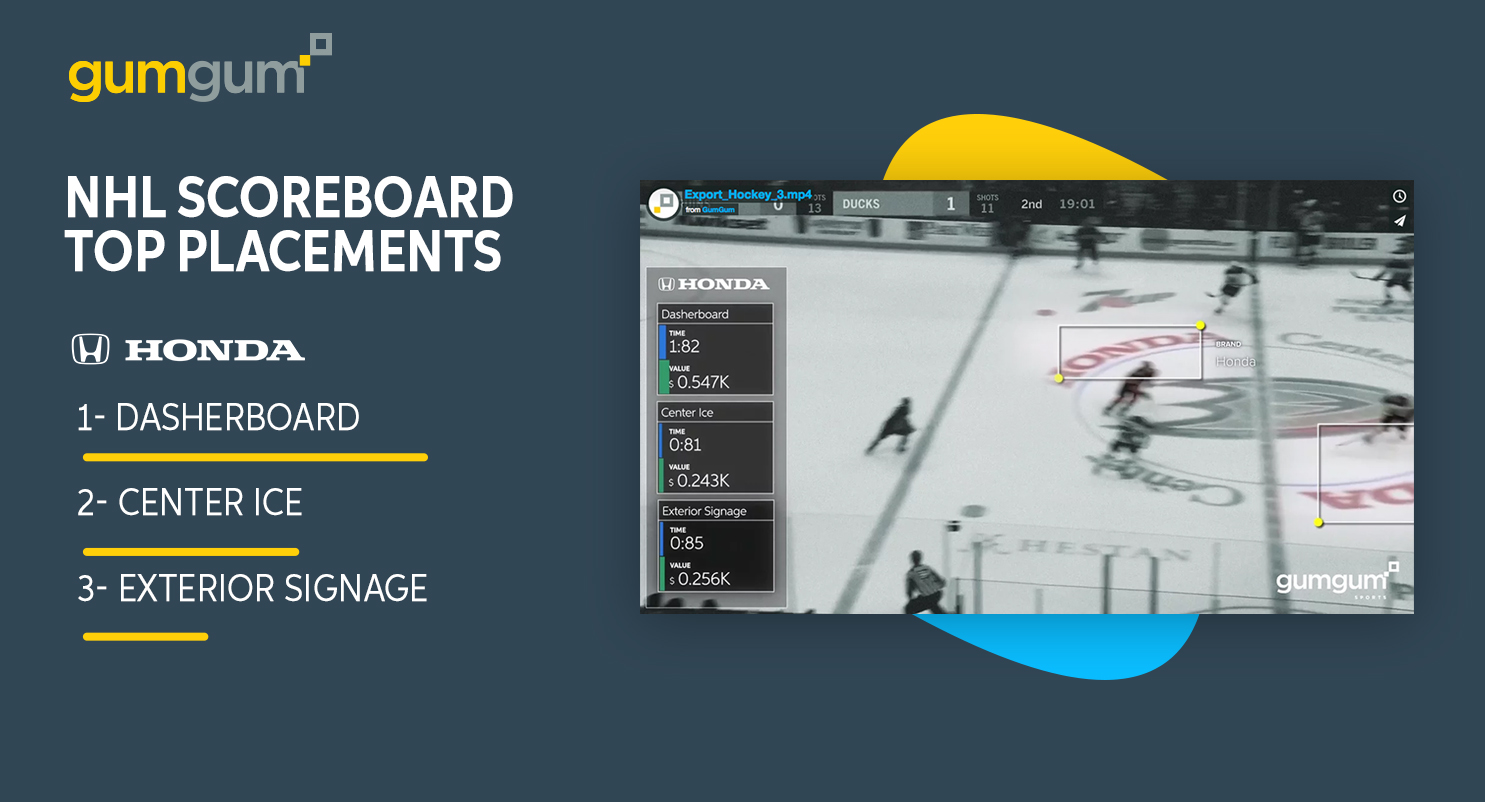
As part of the push to bring clarity to the measurement of these metrics, GumGum Sports recently launched dashboards for the NBA and the NHL. The “Scoreboards”, as the company calls them, are aggregated pieces of data from GumGum Sport’s software that are accessible through only the input of an email. Once inside, users will see such things as the ranking of NBA teams by value of their Twitter accounts as well as what teams were able to drive the most value for their jersey patch partners during the 2017-2018 season.
[the_ad_group id=”948″]
For Jeff Katz, GM of GumGum Sports, the Scoreboards provide a window into what this kind of data can provide for any of the stakeholders who may need could use it.
“We wanted to bring this type of data to the surface,” Katz said. “This type of data hasn’t really been available before. Scoreboard is really a taste of what is possible.”
The NHL Scoreboard will start in conjunction with the league’s 2018-19 season, and follows in the footsteps of the brand’s NBA Scoreboard, which in the first year of jersey patch sponsorships found that 81 percent of the patch’s media value came from social versus TV game broadcasts. Similar to the NBA product, NHL Scoreboard is a social media value benchmarking tool for teams and brands across the NHL filtered by sponsor, team or placement.
For all of the stakeholders that are premium clients of the service, the picture gets broader as they are able to capture not just the sponsor value from team-owned accounts but from the long tail of social (as well as TV and streaming), giving them a more accurate and complete gauge of total social media value.
“We’re seeing 70 to 90 percent more value and exposure by going outside of team-owned accounts,” said Katz when mentioning the hidden value that teams, leagues, and brands lose out on when they aren’t able to capture data that doesn’t come from their own channels.
Outside of its ability to show professionals what value their partners are receiving and giving brands the ability to use it to garner value levels and assure sponsorships are trending positively, the Scoreboard acts as a benchmarking and search tool that teams, brands, and agencies can use to see how they stack up against others and what sponsors are appearing where.
Want more content like this? Subscribe to our daily newsletter!
“You might have a team who wants to identify prospective sponsors, right? So they’ll look at what sponsors are appearing across the different leagues,” Katz said. “It’s also useful if you are a big-market team and you want to be able to show your value relative to others in a good way. It is easy to show benchmarking.”
Katz and his team want the Scoreboards to be used as a way to bring transparency to the market, as well as help those using it to get a better idea of what it actually means.
“The Scoreboard is about demystifying this and about making more data available to more people. With 24/7 capabilities, it makes it easy for any one of our stakeholders to see the data in almost real-time.”
As more partners are looking for tangible ROI for their spend with teams and big spenders like AB InBev shifting to an incentive-based model that rewards teams with more resources based on the performance of their assets, data like this will only become more and more crucial.
